

Inroduction
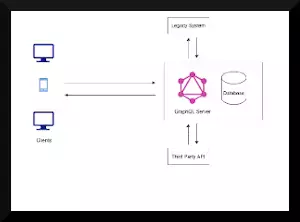
Dgraph is a distributed transactional open-source native graph database and has native support for GraphQL. Created by Manish Rai Jain in 2015 written completely in Go. It is relatively a new player to the Graph Database market. With the ever-increasing need for the Graph system and Databases, the use of GraphQL is also increasing day-by-day. Dgraph is the only database that has native support for GraphQL and is best suited for storing, querying and analyzing the relationship and interconnections.
Features
- Native GraphQL Database
- Horizontal Scalability
- Provides ACID transactions, consistent replication and linearizable reads
- Native support for full-text search and regular expression
- Fault-Tolerant
- Open-Source under Apache 2.0 license
Getting started with Dgraph
There are different ways to run Dgraph Server on your machine. All of them are mentioned in the Dgraph documentation https://dgraph.io/downloads with the download link and the instructions.
- Install Dgraph using Docker
- Dgraph on Kubernetes cluster
- Dgraph for different OS (Windows, macOS, Linux)
- Using Dgraph SDK for Java, Python, Go, Node.js
For the learning purpose, I find that running the standalone docker image for Dgraph is the quickest way to get up and running.
As mentioned in the Docker Hub, This method is for the quickstart purpose and it should not be used in production
So, In this article, we will be going through how to set up and run Dgraph in Docker, creating schemas and graphs with mutation and retrieving graphs with queries.
Setting up Dgraph in Docker
The best way to install Dgraph on your machine is by using Docker. You can refer to this (documentation)[https://docs.docker.com/get-docker/] if you haven’t installed Docker in your machine yet.
To install Dgraph on your machine, you can run the following docker pull command.
docker pull dgraph/standalone
This will download you the latest version of the Dgraph on your Docker machine
If you want to download a specific version, you can use the following command and replace the version in the command with the one you want to download.
docker pull dgraph/standalone:v20.03.0
You can list the available images using the following command:
docker images
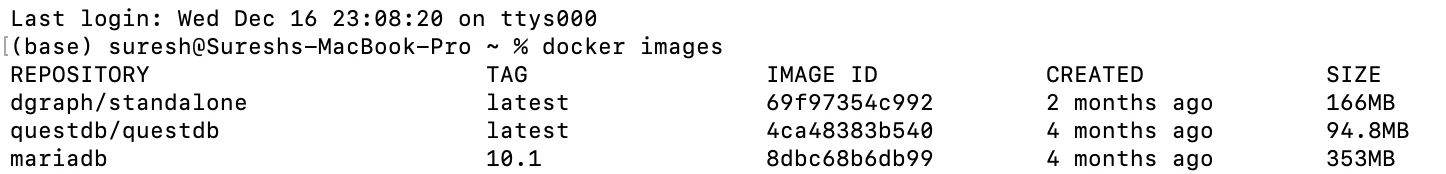
You can also view the list of available images from Docker Dashboard.
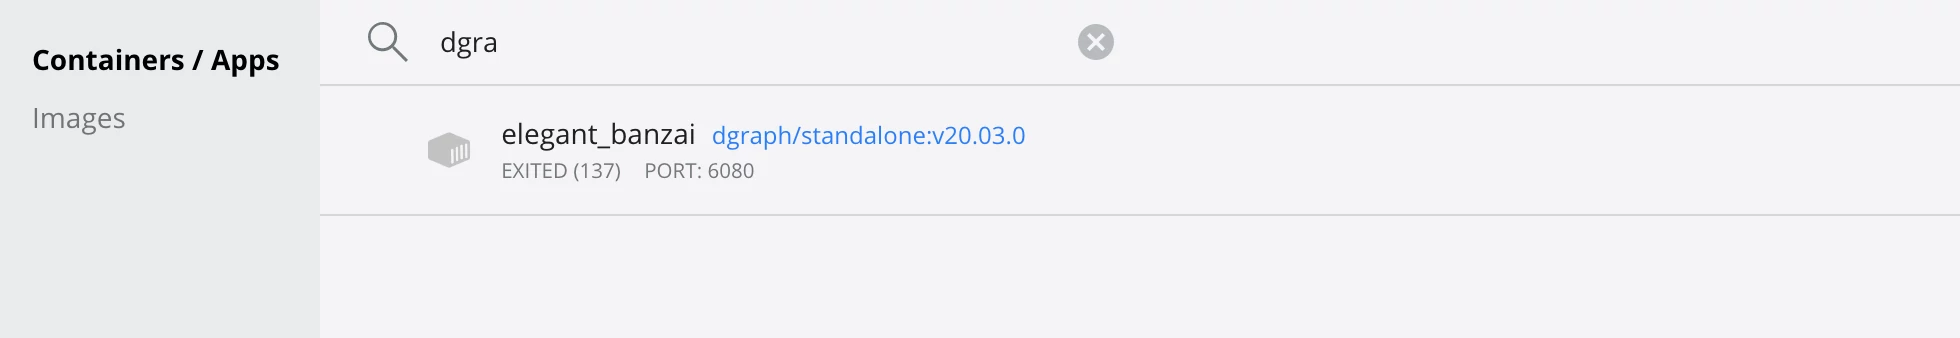
To start Dgraph, you need to either run it from Docker Dashboard or should run the following command:
docker run -it -p 8080:8080 -p 9080:9080 -p 8000:8000 dgraph/standalone
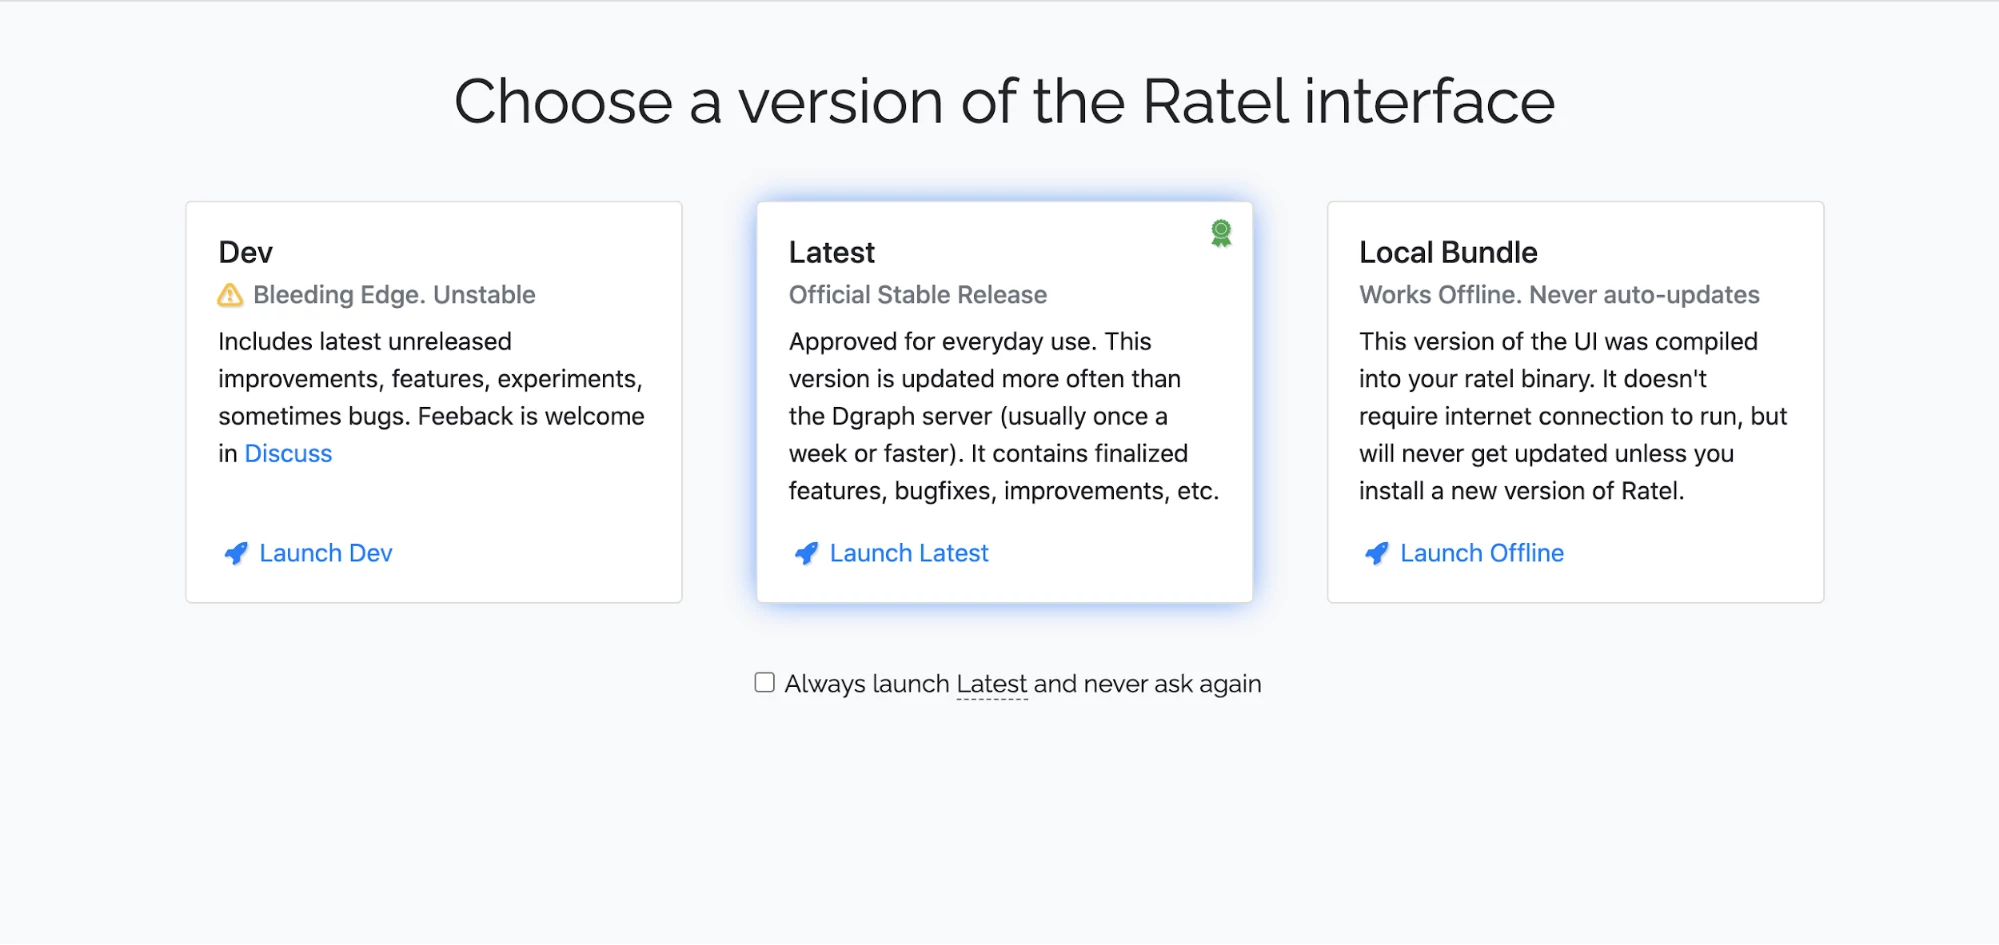
Ratel is a graphical user interface created to explore the graph database. You can use ratel to create and drop graph schema, write queries and mutation and visualize the result.
You can access ratel on port 8000 of your localhost and the interface looks like this.
GraphQL+-
Dgraph Query Language (DQL) (also known as GraphQL+-) a modified version of GraphQL resulted by adding and removing features to get the result that is the best fit for graph databases. It is a feature-rich variation of GraphQL with added support for Graph operations.
Features of GraphQL +-
- Pagination ( using First, Last, Offset and After)
- Counting number of entities
- Sorting of the results
- Aggregation
- Filters using boolean connectives
- Alias
- Group By
- Recursive Queries
Mutation ( Creating a Graph)
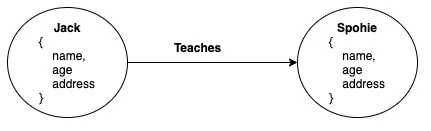
The mutation is the process of creating, updating and deleting data stored in the database. Mutation in DGraph can be achieved by using (RDF Triplets)[https://en.wikipedia.org/wiki/Semantic_triple] or using JSON. Mutation in DGraph consists of edges and nodes. Nodes can be considered as an entity and edges can be considered as the relationship between those entities. In the example below, two people ( Jack and Sophie) are nodes and they have properties (name, age and address) which are called predicates. These two nodes are connected by the edge Teaches which defines the relationship between them. A graph may or may not have the edges between nodes.
How to write a Mutation?
Let’s see an example of the mutation using the Ratel interface.
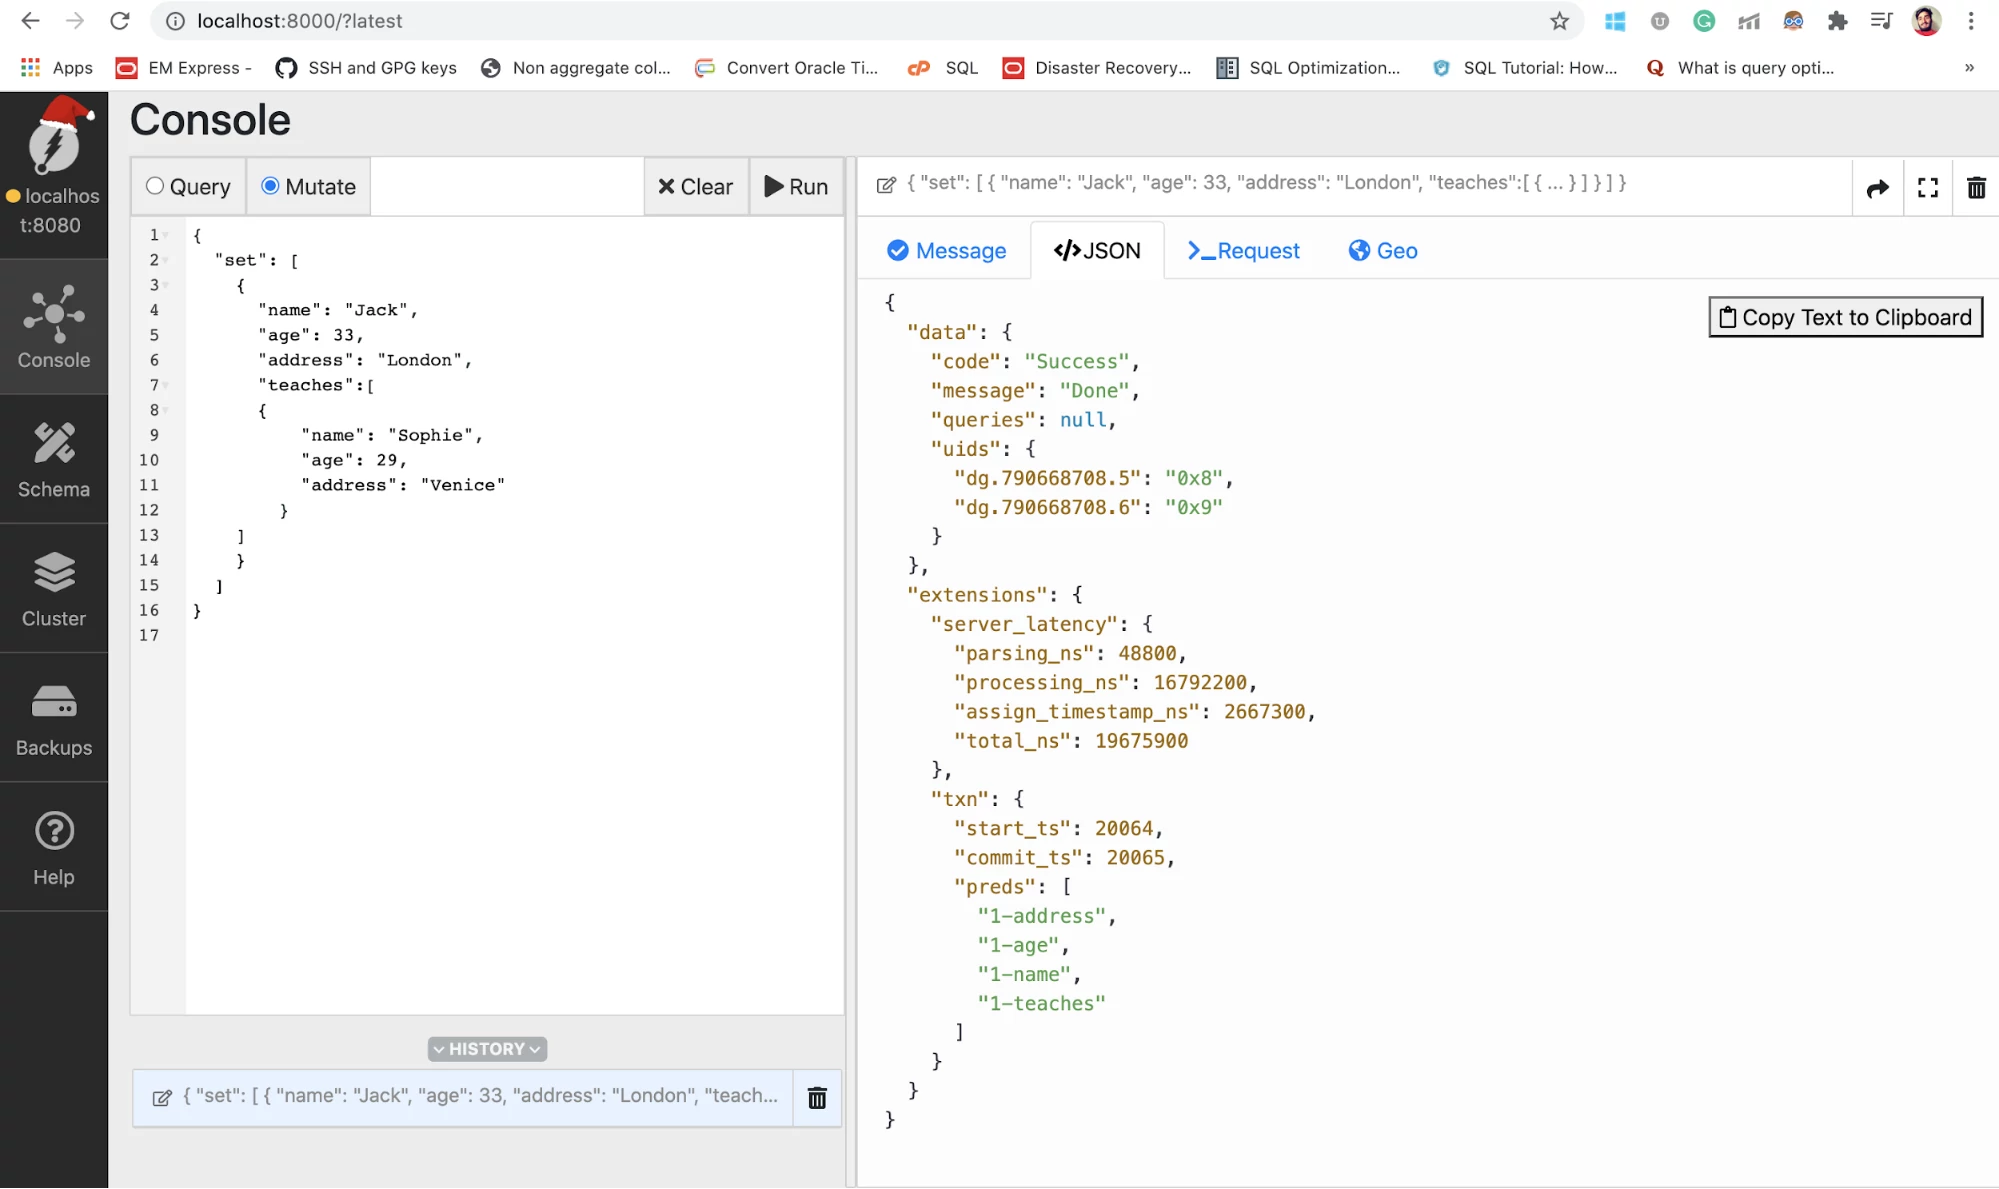
Ratel makes it easier for us to create and execute mutations. To write a mutation in the Ratel interface, you need to click on the Mutate tab in the interface and write a query on the console. Mutations can be written in either RDF Triplets or in JSON format. We will be using JSON format in our example as it is easier to understand.
Mutation can be created using “set” followed by an array of all of the nodes you want to create for that mutation. Fields and the values are also added for every node.
{
  "set": [
    {
      "name": "Jack",
      "age": 33,
      "address": "London"
    },
    {
      "name": "Sophie",
      "age": 29,
      "address": "Venice"
    }
  ]
}
This mutation will create two nodes, Jack and Sophie. If you want to create an edge between a node (Teaches in case of this example), you need to create node Sophie inside node Jack with Teaches relationship.
{
  "set": [
    {
      "name": "Jack",
      "age": 33,
      "address": "London",
      "teaches":[
   		{
      		"name": "Sophie",
      		"age": 29,
      		"address": "Venice"
    		}
		]
    }
  ]
}

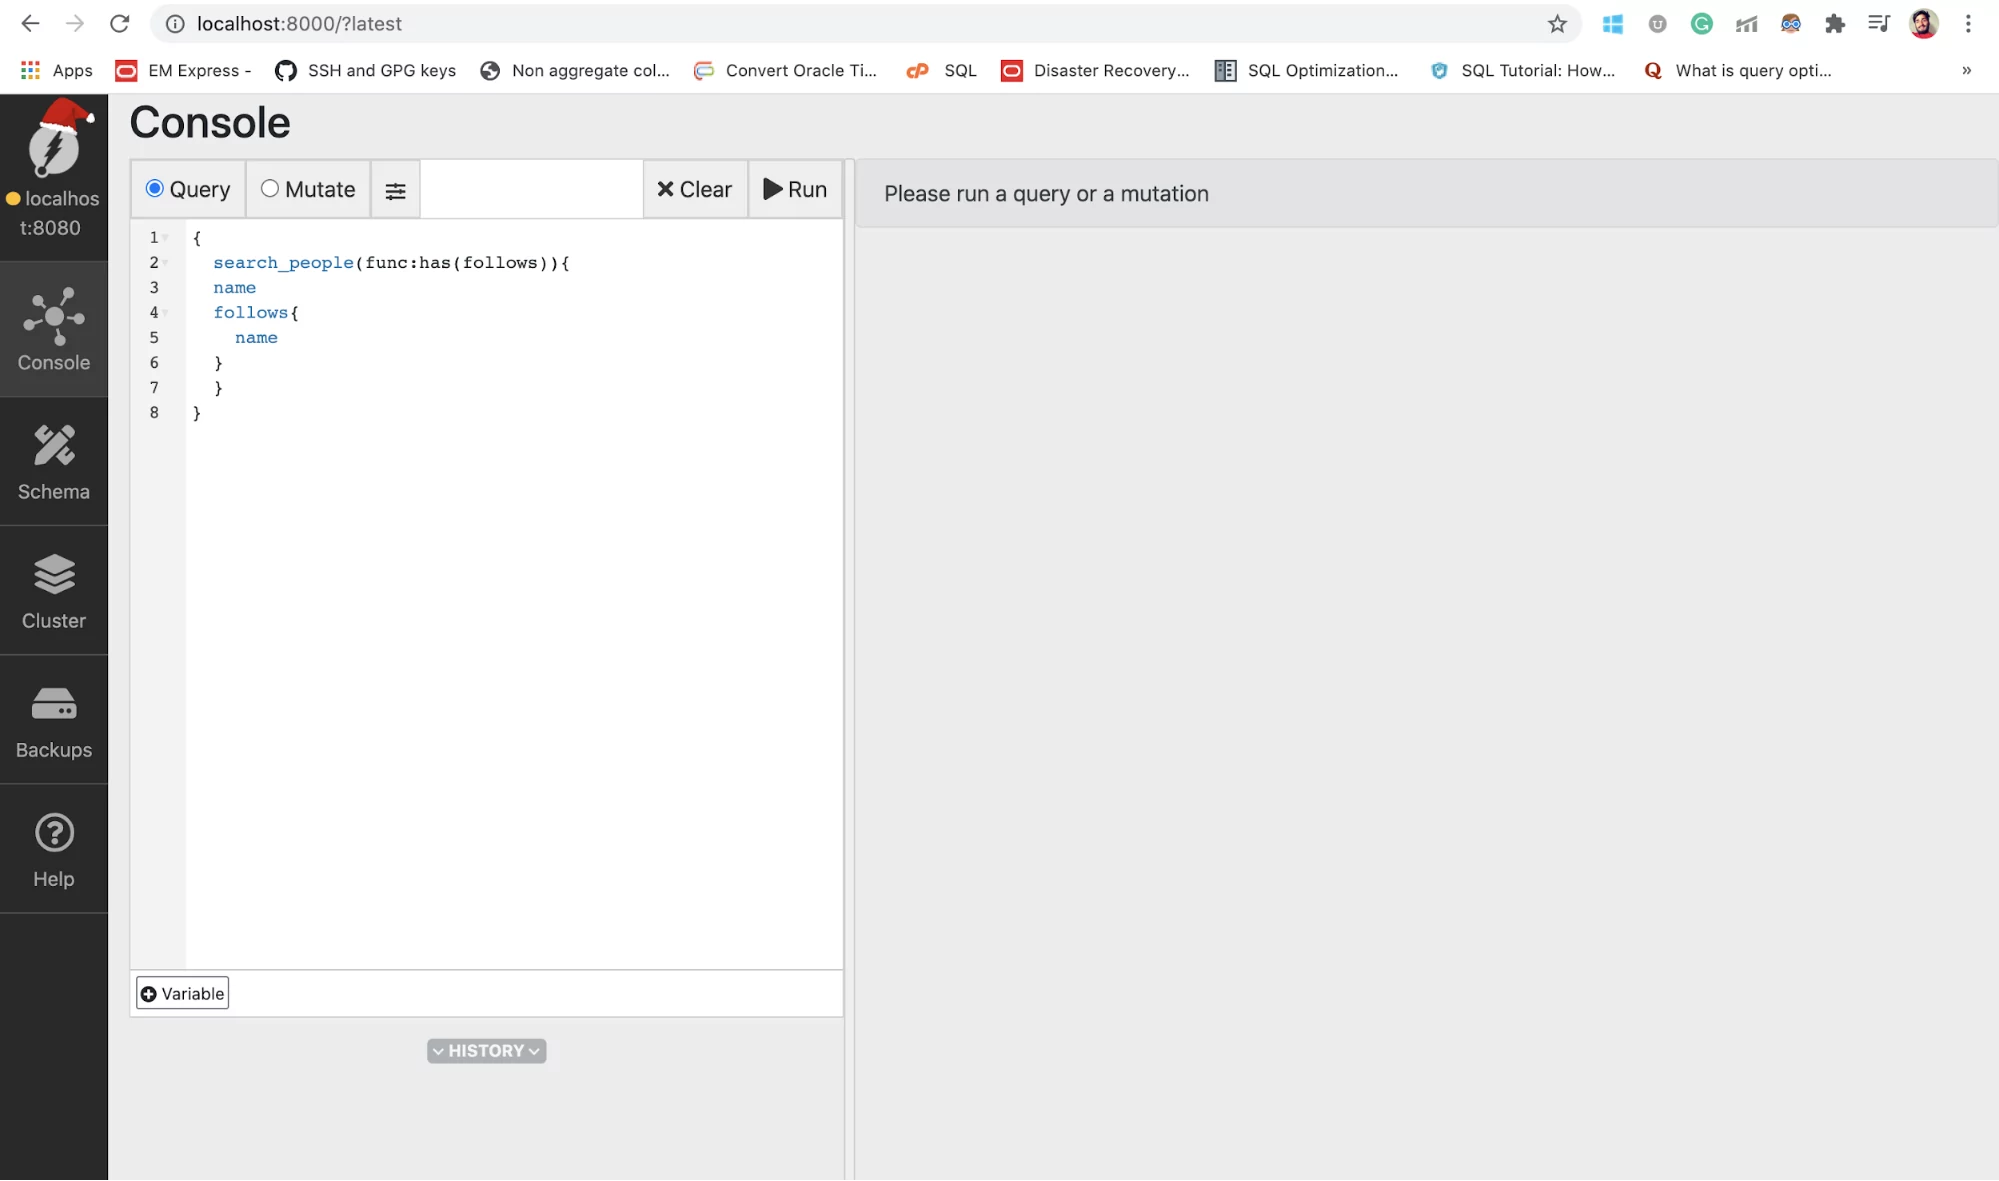
Querying
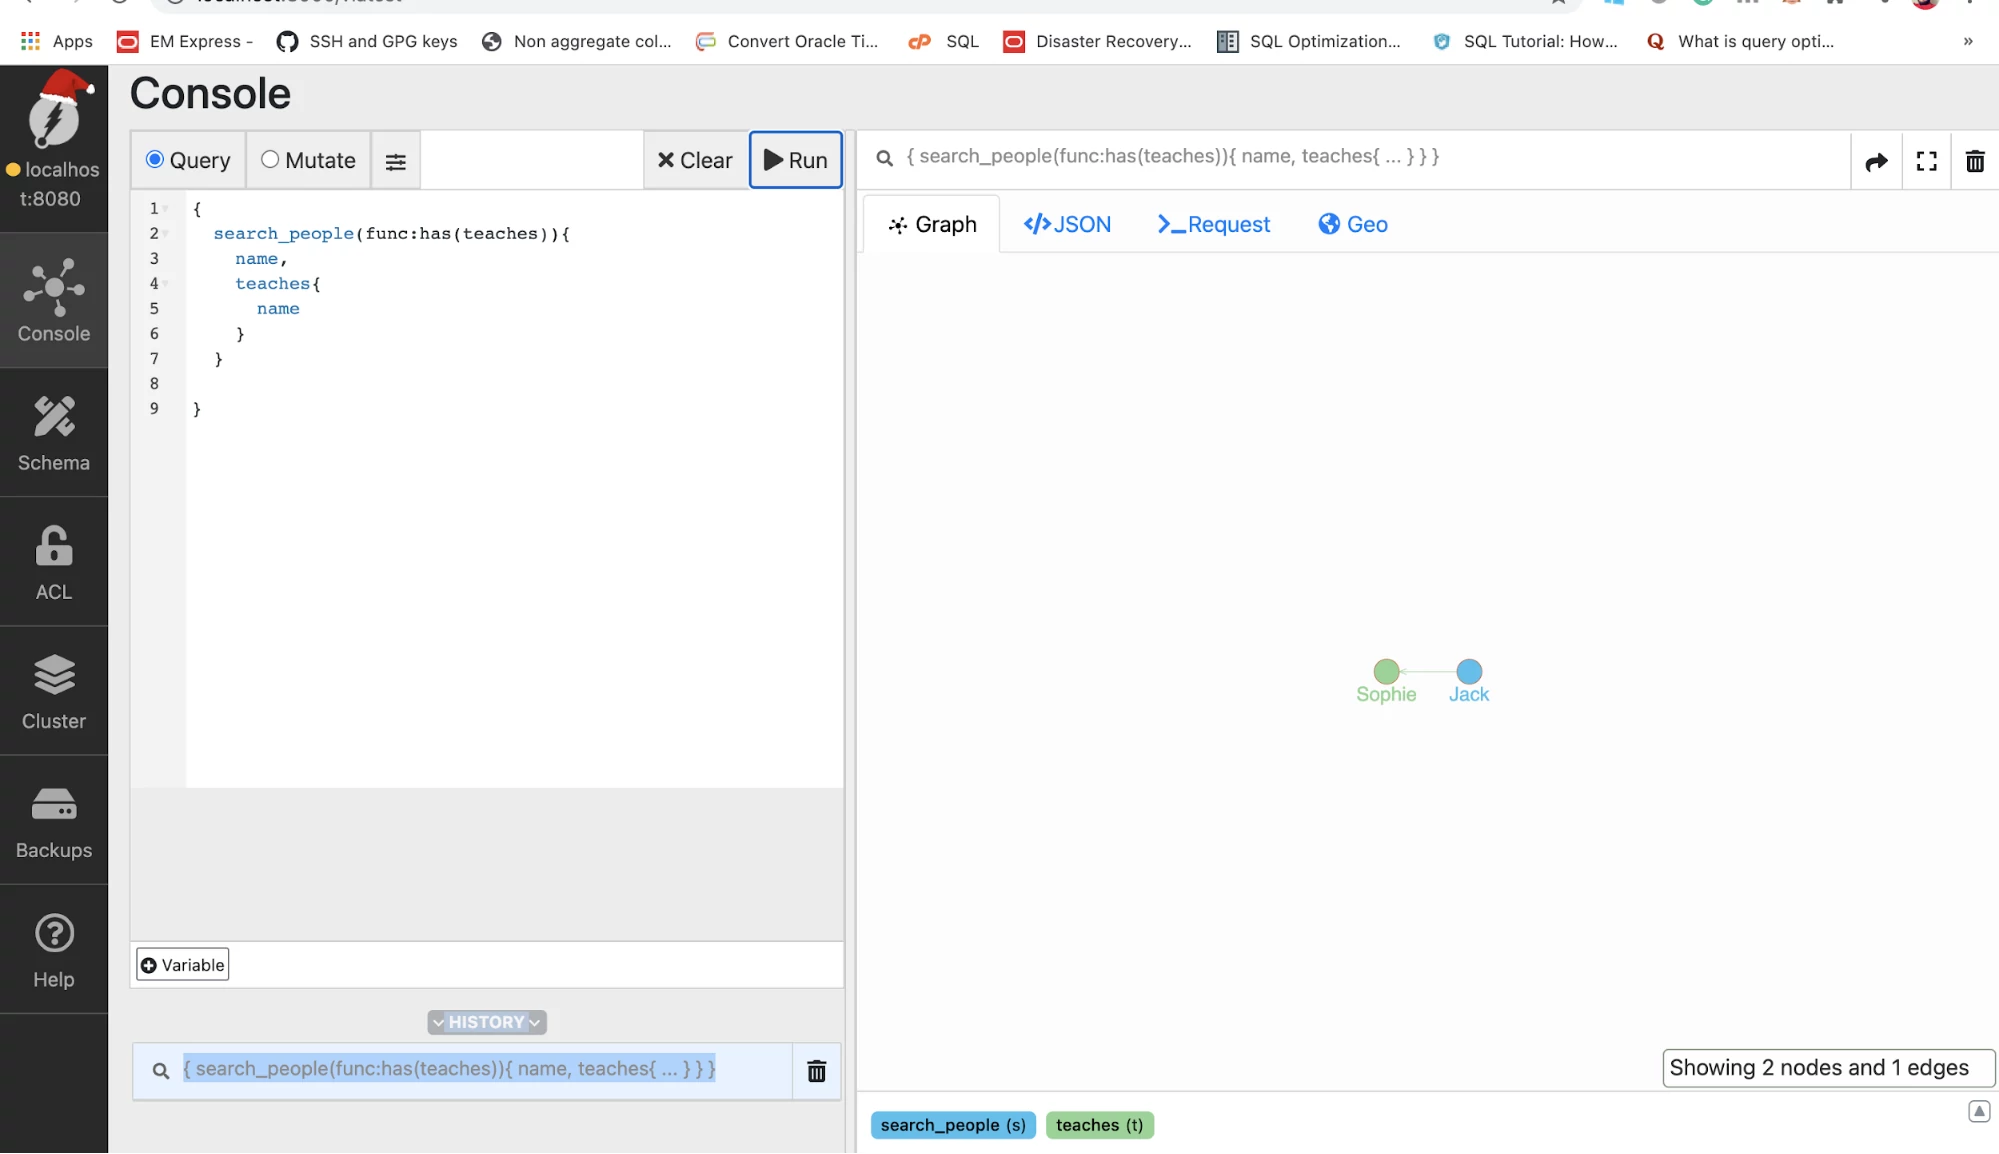
Ratel provides a console where we can write queries and view the result in the form of Graph or JSON result. Let’s see an example of a query for the schema we created in our previous example. In this example, we will write a query to find all peoples and their followers. In DQL, we can give the query a name (search_people in case of this example). Ratel provides an interactive interface to show the results as actual nodes and edges.
{
  search_people(func:has(teaches)){
    name,
  	teaches{
      name
    }
  }
}
For our next example, let’s find out the name and the number of students for each teacher. I have added multiple records and our mutation example and added that in our database.
{
  search_people(func:has(teaches)){
    name,
  	total_students:count(teaches)
  }
}
I am using an alias to give the result from the count operation a name. Let’s see the results in JSON format this time.
Let’s Conclude
Although DGraph is in an evolving phase, it is a great solution for problems like a social networks or analysis systems that include graph-oriented architecture. For a complex database system having multiple joins, designing does not cost much. But, writing complex queries against those relationships would certainly cost a huge amount of resource and time. DGraph on the other hand provides low-latency, high throughput query execution even with multiple numbers of joins.
You can find the detailed info on DGraph from the official DGraph Documentation .
You can also find some benchmark comparisons regarding DGraph and other databases like neo4j here .